Vegetation coverage over North America
as seen by satellite observation and modelling study
Vegetation has an important role to play in order to regulate our climate system through land-atmosphere exchange of water, energy and carbon fluxes. Scientists are putting their efforts to improve our understanding the impacts of vegetation on climate and vice versa through cutting-edge modelling, satellite- and ground-based observations. However, modelling the complex physical processes between land and atmosphere is challenging. In particular, uncertainties remain regarding source and sink of atmospheric CO2 due to disagreements among computer models attributed to varying ways of representing the terrestrial ecosystem processes in the models. Of the uncertainties, strength of CO2 fertilization effect and differences in the response of vegetation are considered as the primary sources. Another source of uncertainty is the design of computer models as they differ in representing spatial distribution and composition of vegetation, and the impact of climate change. For instance, model with a coarse spatial grid resolution cannot explicitly resolves climatic niches, which in turn contribute to biases in simulated vegetation distribution.
In this study, vegetation distributions across North America have been evaluated using a CTEM (Canadian Terrestrial Ecosystem Model) computer model. The study uses 1°x1° horizontal model grid resolution, which is a much higher than the resolution (3.75°) used in the previous studies. The model divides the vegetation into 9 different types – needleleaf evergreen and deciduous trees; broadleaf evergreen, deciduous dry and deciduous cold trees; C3 and C4 crops and grasses – known as plant functional types (PFTs). The modelled vegetation distributions are compared with satellite (MODIS) and ground-based (WANG06) observations. The model successfully reproduces the broad geographical distribution of trees, grasses and bare ground. In particular, compared to the observation-based estimates, the simulated fractional vegetation coverage is lower in the arid south-west North American region and higher in the Arctic region. The lower than observed simulated vegetation coverage in the south-west region is attributed to lack of representation of shrubs in the CTEM model, and plausible errors in the observation-based data sets. The observation-based data indicates vegetation fractional coverage of more than 60% in this arid region, despite only 200-300 mm of precipitation that the region receives annually and observation-based leaf area index (LAI) in the region lower than one. The higher than the observed vegetation fractional coverage across the Arctic is due to lack of representation of moss and lichen PFTs in the CTEM model. Furthermore, inadequate representation of permafrost soil layers in the model resulted overestimated coverage of grass in the region. However, the CTEM model generally reproduces the observed distribution and coverage of primary tree PFTs (needleleaf evergreen and broadleaf cold deciduous trees). The model shows increasing trend of simulated LAI and fractional coverages of tree PFTs after 1960s which indicates the response of warming due to anthropogenic activities. However, differences between observed and simulated PFT coverages highlight limitations in the model and provide insight into physical and structural processes that need improvements. For further details, please visit here or contact at rudra.shrestha@royalroads.ca.
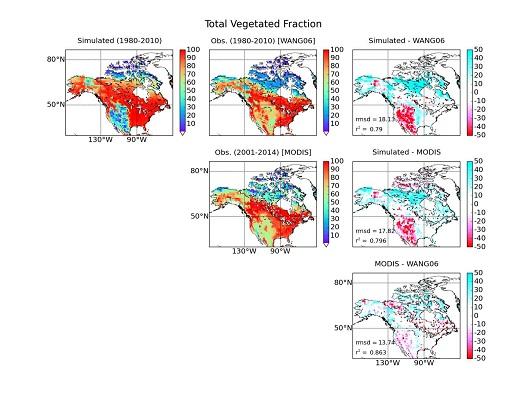
Figure 1: Spatial distribution of total vegetated coverage across North America. Simulated, observation-based, and differences are presented in the left, middle and right columns, respectively. The differences column includes model biases with respect to WANG06 (Wang et. al, 2006; top panel) and MODIS (Moderate Resolution Imaging Spectroradiometer; middle panel) satellite, and the difference between the two observation-based estimates (bottom panel). Root mean square difference (rmsd) and coefficient of determination (r2) are also shown in each case.